
The U.S. Geological Survey (USGS) reported that May 2013 portland and masonry cement shipments were 8.49 million short tons (Mst), a gain of 3.1% compared to May 2012 . This was the strongest performance since January’s 4.4% year-over-year gain. Cumulative 2013 U.S. cement consumption through May totaled 32.69 Mst, up a mere 0.9% from January-May 2012.
Concrete is the most popular and widely-used building material in the world. Hydraulic cement — i.e. hardens in the presence of water — is the glue that binds crushed stone, sand and a few admixtures into concrete. Portland cement is by far the most common form of hydraulic cement. There is a recognized standard so that portland cement is virtually identical throughout the world.
Unique among building materials, concrete is used in virtually all types of construction: residential, nonresidential, and public works. Currently, the strong resurgence of U.S. housing construction is boosting cement and concrete demand but weaker nonresidential markets and declining public works (aka infrastructure) remains a burden.
U.S. cement consumption peaked in 2006, along with most construction markets, and didn’t begin to recovery until 2012. Thus, the Great Recession started earlier and lasted longer for construction, concrete and cement demand than the overall economy.
Examining only cumulative January-May numbers, 2013 U.S. cement consumption of 32.69 Mst was 19.4% above the 2011 trough but remains 40.2% below the 2006 peak.
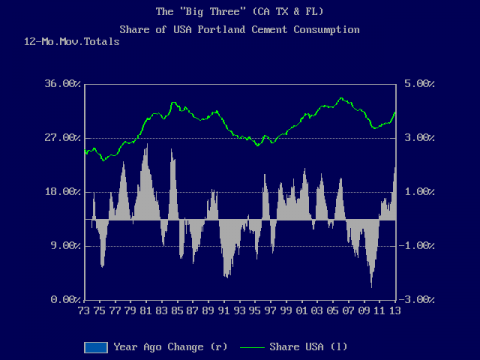
Cement consumption varies greatly by geography and season: winter shipments are far below summer, the peak of the building season, especially in regions that have four distinct seasons. Weather has a huge impact on construction, concrete and cement activity. Computing 12-month moving totals or averages are the safest ways to control for seasonality.
Bottom line, U.S. cement consumption began to recover from the Great Recession in 2012, six years after the 2006 peak. The rebound in housing construction is a definite positive for construction, concrete, and cement activity, but continued weakness in many nonresidential building markets and outright declines in most public works markets remain a drag on consumption.
Future postings will examine the wide state-by-state differences in construction, concrete and cement demand. Cement and concrete production, as opposed to consumption, will also be discussed.


 mber 2008, two months after the collapse of Lehmann Bros. and the near collapse of the world financial system, not one state had an increase in portland cement consumption from November 2007. Zip, zero, nada. That had never happened before. The low point for the 6mma came in August 2009 at 6.2%. The diffusion index peaked in July 2004 at 75.2% for the 6mma. In the two prior years, the index for individual months was over 90% twice. The November 2010 portland cement diffusion index, the latest month available from the U.S. Geological Survey (USGS), hit 49.0%, following a 2010 high point in April of 70.6%, just before the government mortgage subsidy program ended. Looking at the 6mma, the 2010 peak was in August at 49.0% with a slow decline to 46.1% in November.