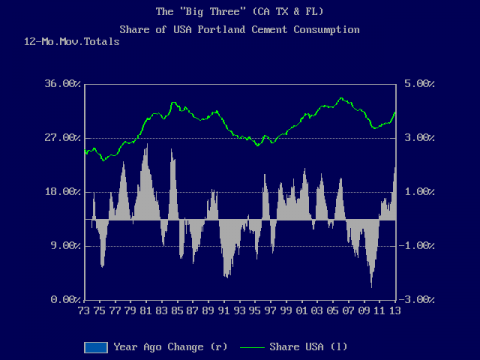
For many decades three states have led the United States in portland cement consumption: California, Texas, and Florida. The Golden and Lone Star states have been the top two for over a half century. For many years, California was the top cement producer with Texas #2, but Texas has overtaken California in recent years. Florida was always third place though it was narrowing the gap until the Great Recession hit the Sunshine State particularly hard.

The “Big 3” cement-consuming states contributed significantly to the 1992-2006 boom as well as the post-2006 bust.
Accounting for about 30% of total U.S. cement demand, the “Big 3” are hugely important to national trends and cycles. Examining 12-month moving totals over the past 40 years, the market share of the Big 3 has ranged from a low of 23.2% to a high of 33.7% with an average of 29.1%. For the “Big 2” — California and Texas — the range has been 17.7%-26.2%, averaging 22.3%, evenly split between the two states. Florida’s share had a 4.7%-9.4% range and a 40-year average of 6.8%.
No other states come close to the Big 3. None has an average market share above 4%, Illinois being the closest at 3.95%. The combined market shares of the next 10 largest states in portland cement demand averaged 30.3% over the past 40 years, about the same as the Big 3. That leaves 40% of U.S. cement sales to the remaining 37 states and the District of Columbia.

California, Florida and Texas are the three largest cement consuming states, accounting on average for about 30% of national cement sales.
Let’s consider the behavior of the Big 3 compared to the nation during the recent cyclical peak and trough. March 2006 was the record peak for U.S. portland cement consumption with a 12-month moving total (12MMT) of 138.8 million short tons (Mst). The U.S. Geological Survey is the source of the monthly cement data that is the basis of this analysis. In those 12 months, cement demand increased 8.1% or 10.45 Mst. During this period Big 3 cement consumption totaled 46.5 Mst for a 33.5% market share. There was a 12.2% gain over the year ago 12MMT amounting to 5.1 Mst, which meant that the Big 3 were responsible for 48.5% of the national increase.
The cyclical trough came in March 2010 with a national 12MMT of 73.6 Mst, 47% below the 2006 cyclical peak. At the bottom the 12MMT for the Big 3 equaled 21.2 Mst of portland cement consumed and a 28.8% market share. From the 2006 peak Big 3 cement demand was down 54.3%. Total portland cement consumption declined 24.3% or 23.7 Mst in the 12 months ending March 2010. The Big 3 dropped 29.1% or 8.7 Mst in this period, accounting for 36.8% of the loss. Thus leading up to both the peak and the trough, the Big 3 accounted for a larger portion of the change in the 12-month period than their absolute market shares.
Looking at Texas, California, and Florida individually we see that Texas has significantly outperformed the other two. Its market share has grown steadily since 1990 and currently is at a record 16.6%. California’s share of total portland cement consumption peaked at a higher level in the late 1980s than in 2006, and has barely recovered. Florida’s share peaked in 2006, crashed, and has only recently started to recuperate. Its current share is comparable to the mid-1970s.

Texas significantly outperformed California and Florida in the Great Recession. Indeed, the Lone Star State has markedly gained share on the other two since 1990.
Recovery from the Great Recession has finally arrived for U.S. portland cement. In the 12 months ended January 2013, national cement consumption totaled 84.9 Mst, up 7.9% or 6.3 Mst from the year ago level. The Big 3 continued to lead the way with a 15.0% increase to 26.6 Mst. Their market share was 31.4%, and they accounted for 55.6% of the 12-month gain. Texas was the big winner. Lone Star State portland cement demand climbed 20.1% to 14.1 Mst, accounting for 37.7% of the national increase and two-thirds of the Big 3 gain.

