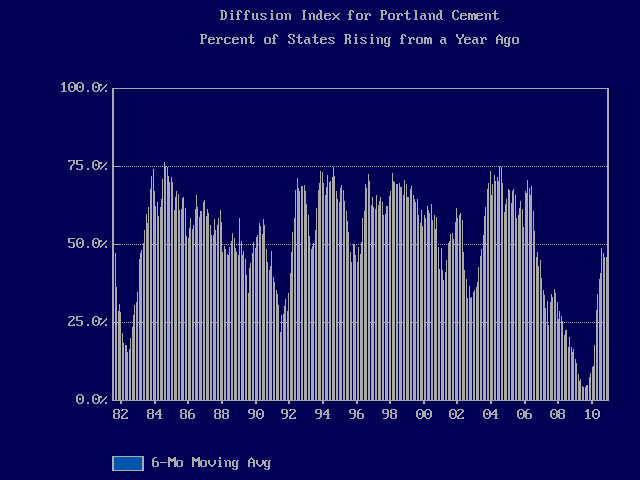
I like to look at the diffusion index of monthly state portland cement consumption. Each month the diffusion index is the count of the number of states that experienced an increase in portland cement shipments from the same month a year ago. It shows the geographic breadth of cement demand growth without regard to the size of the state markets. The accompanying chart shows six-month moving averages (6mma) of year-over-year monthly percent changes. Averaging helps smooth out the volatility of monthly cement shipments, to give a clearer picture of cyclical trends.

 In Nove
 mber 2008, two months after the collapse of Lehmann Bros. and the near collapse of the world financial system, not one state had an increase in portland cement consumption from November 2007. Zip, zero, nada. That had never happened before. The low point for the 6mma came in August 2009 at 6.2%. The diffusion index peaked in July 2004 at 75.2% for the 6mma. In the two prior years, the index for individual months was over 90% twice. The November 2010 portland cement diffusion index, the latest month available from the U.S. Geological Survey (USGS), hit 49.0%, following a 2010 high point in April of 70.6%, just before the government mortgage subsidy program ended. Looking at the 6mma, the 2010 peak was in August at 49.0% with a slow decline to 46.1% in November.
Mirroring what occurred in U.S. homebuilding, cement demand had a spurt of activity early in the year but then slightly tapered off with the end of the government stimulus. Of course, 46.1% is a hell of a lot better than 6.2%, seven times better to be exact. The diffusion index shows that the economic recovery has clearly taken hold in the U.S. cement industry, but it is still a long way away from former good times.

